
Air Compressor Capacity, Power and Specific Energy
The power bill does not follow capacity: specific power is the number that moves.
Key Principles at a Glance 7 points
- Capacity is meaningless without a basis, because the same mass of air occupies different volumes at different pressures and temperatures.
- Specific power is the honest trend indicator: 110 kW for 20 m3/min becoming 112 kW for 18 m3/min is a 13% rise in specific power for a 2% rise in power.
- Power flows through a chain of theoretical compression power, indicated power, brake or shaft power and motor input power, with a loss at every link.
- Indicated power follows indicated mean effective pressure multiplied by piston displacement: 4 bar over 0.50 m3/s gives about 200 kW.
- Compressor capacity falls as discharge pressure rises, so raising receiver pressure costs capacity as well as power.
- Stepped unloading at 0, 50, 75 and 100% matches demand in coarse steps, while bypass and suction-valve unloading waste work that clearance-pocket and variable-speed control avoid.
- Lifecycle power cost and distribution-system leaks dominate compressor economics, so purchase price alone is a poor basis for selection.
1. Learning objectives
Course position: Air-compressor sequence, Topic 7
Level: Compressor performance, selection, and operational economics
Main question: How much gas does a compressor deliver, how much power does it require, and why do capacity, pressure, temperature, efficiency, and control affect one another?
After studying this chapter, you should be able to:
- Define compressor capacity on a stated measurement basis.
- Distinguish piston displacement, actual capacity, free-air delivery, ACFM, ICFM, and standard flow.
- Distinguish indicated, brake, shaft, and motor power.
- Explain compression efficiency and mechanical efficiency.
- Calculate piston displacement for a single- or double-acting cylinder.
- Estimate theoretical compression power.
- Explain why actual power exceeds ideal power.
- Explain specific power consumption.
- Explain the effects of suction pressure, discharge pressure, temperature, speed, and gas composition.
- Explain capacity control and power limitation.
- Explain part-load power behaviour.
- Compare capacity and power during single- and multistage operation.
- Interpret capacity and power trends during watchkeeping.
- Select useful measurements for a compressor performance test.
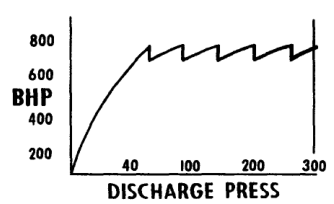
2. Capacity is meaningful only with conditions
Compressor capacity is not a single universal number.
A flow rate must identify:
- Gas or air composition
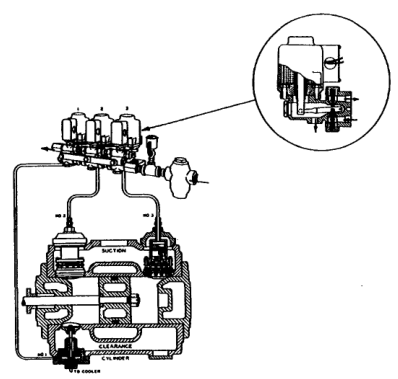
- Suction pressure
- Suction temperature
- Humidity
- Discharge pressure
- Flow-meter location
- Mass or volume basis
- Standard or actual reference condition
- Loaded or unloaded state
- Compressor speed
The same machine can produce different volumetric readings at different suction temperatures and pressures while processing nearly the same mass flow.
Always ask:
Capacity at what pressure, temperature, gas condition, and location?
3. Piston displacement
Piston displacement is the geometric volume swept by the piston per unit time.
For a single-acting cylinder:
where:
- A = piston area
- L = stroke length
- N = revolutions or cycles per unit time
For a double-acting cylinder, head-end and crank-end volumes are added, with the crank-end area reduced by the piston-rod area.
Piston displacement is useful for:
- Comparing machines
- Estimating geometric size
- Calculating capacity
- Estimating cylinder loading
- Establishing a performance baseline
It is not the same as delivered capacity.
4. Actual capacity
Actual capacity is often expressed at compressor intake conditions.
Common terms include:
- ACFM: actual cubic feet per minute
- ICFM: intake cubic feet per minute
- FAD: free-air delivery
- SCFM: standard cubic feet per minute
- Normal m³/min: volume referred to a specified normal condition
- Mass flow: kg/s or kg/h
The compressor reference identifies actual capacity with ICFM or ACFM and distinguishes it from piston displacement.
For a reciprocating compressor:
where η_v includes clearance and practical filling losses.
5. Free-air delivery
Free-air delivery is the equivalent volume of delivered gas referred to an agreed reference condition, commonly near atmospheric pressure and a specified temperature.
It is useful because the actual discharge volume is small at high pressure, while the equivalent free-air quantity describes the amount of air processed.
The reference condition must be stated. Different standards may use different:
- Atmospheric pressure
- Temperature
- Humidity
- Unit definitions
Never compare two “free-air” ratings without checking their reference conditions.
6. Actual volume versus mass flow
For an ideal gas:
and:
Therefore:
At higher suction pressure, the same actual volume contains more mass.
At higher suction temperature, the same actual volume contains less mass.
This explains why actual volumetric flow alone can be misleading when comparing compressors installed at different locations or operating under different intake conditions.
7. Converting actual volume between conditions
For the same gas mass, neglecting compressibility variation:
Therefore:
Use absolute pressure and absolute temperature.
For real gases, include compressibility factor:
Air at moderate pressure can often be approximated as ideal, but process gases may require Z.
8. Capacity example: actual to standard basis
A compressor draws 100 m³/min at:
- Suction pressure = 1.05 bara
- Suction temperature = 303 K
Find the equivalent volume at 1.00 bara and 293 K, assuming ideal gas.
The numerical result changes if humidity, compressibility, or another standard basis is specified.
9. Capacity and volumetric efficiency
Volumetric efficiency is:
Capacity falls when:
- Clearance increases
- Compression ratio increases
- Suction temperature rises
- Suction pressure falls
- Valves leak
- Rings leak
- Intake passages restrict flow
- Capacity-control devices unload the cylinder
A capacity guarantee must state the expected volumetric efficiency or the complete operating conditions.
10. Power levels in a compressor installation
Power appears at several points:
The terminology differs by industry and manufacturer, so use the machine’s stated convention.
Common levels are:
- Theoretical or ideal compression power
- Indicated power
- Brake or shaft power
- Motor input power
11. Theoretical compression power
For an ideal polytropic compression process:
For continuous flow:
where:
- n = polytropic exponent
- P₁ = suction absolute pressure
- P₂ = discharge absolute pressure
- T₁ = suction absolute temperature
- R = specific gas constant
- dotm = mass flow
Use consistent units.
12. Practical horsepower relationship
The compressor calculation reference gives a theoretical reciprocating-compressor horsepower relationship based on ACFM, suction pressure, pressure ratio, and the compression exponent.
The exact constant depends on the selected unit system.
The calculation must then be corrected for:
- Compressibility
- Valve efficiency
- Compression efficiency
- Mechanical efficiency
- Gas composition
- Intercooling
- Multistage arrangement
Do not use a horsepower formula without checking whether it returns theoretical, indicated, brake, or motor power.
13. Compression efficiency
Compression efficiency compares theoretical compression power with actual indicated cylinder power.
Losses include:
- Suction-valve pressure drop
- Discharge-valve pressure drop
- Port restriction
- Gas pulsation
- Valve slip
- Ring leakage
- Heat-transfer departure from the assumed process
The compressor reference identifies valve pressure drop and fluid losses as major compression-efficiency factors.
14. Mechanical efficiency
Mechanical efficiency compares power delivered to the compressing cylinders with power supplied at the shaft.
Mechanical losses occur in:
- Main bearings
- Crankshaft bearings
- Crosshead shoes
- Connecting-rod bearings
- Piston-rod packing
- Oil pumps
- Couplings
- Gears or belts
Poor alignment, worn bearings, poor lubrication, and excessive packing friction reduce mechanical efficiency.
15. Overall efficiency
A simplified overall efficiency from motor input to compressed gas is:
It includes:
- Thermodynamic compression efficiency
- Mechanical efficiency
- Coupling or belt efficiency
- Motor efficiency
- Electrical losses
- Auxiliary equipment power
The most useful operational measure is often specific power:
or power per standard volume.
16. Indicated power
Indicated power is obtained from the work done in the cylinder, usually from the indicator diagram or pressure trace.
Conceptually:
The p-V card provides the cylinder work directly through its enclosed area.
Indicated power includes thermodynamic and valve-flow losses inside the cylinder but does not include all crankcase and motor losses.
17. Brake or shaft power
Brake or shaft power is the mechanical power supplied to the compressor shaft.
It is greater than indicated power because it must overcome:
- Bearing friction
- Crosshead friction
- Packing friction
- Lubrication-pump power
- Mechanical drive losses
For a measured motor input, also account for motor and coupling efficiency.
18. Motor input power
Motor input power is the electrical power drawn by the motor.
For a three-phase motor:
where:
- V = line voltage
- I = line current
- cosφ = power factor
Use actual measured electrical power when possible rather than estimating from current alone.
Motor current is affected by:
- Voltage
- Power factor
- Motor efficiency
- Load
- Harmonics
- Temperature
19. Power-flow diagram
If the compressor delivers less gas while input power remains unchanged, specific power rises even if motor current does not exceed its limit.
20. Why actual power exceeds theoretical power
Theoretical power assumes ideal flow and compression.
Actual power is higher because:
- Valves need pressure difference to open.
- Gas accelerates through ports.
- Valve plates have inertia.
- Flow separates or pulsates.
- Rings leak.
- Gas may be recompressed after valve slip.
- Bearings and packing create friction.
- Cooling and auxiliaries consume power.
The difference between ideal and actual power is not automatically a fault; a baseline is required.
A trend away from baseline is the useful warning.
21. Effect of suction pressure on power
At fixed discharge pressure, lower suction pressure causes:
- Higher compression ratio
- Lower gas density
- Lower mass capacity
- Greater clearance loss
- Often higher power per unit of delivered gas
Absolute suction pressure must be used.
At altitude or with a blocked filter, suction pressure may fall enough to derate the machine.
22. Effect of discharge pressure on power
Increasing discharge pressure causes:
- Higher compression ratio
- More compression work
- Later discharge-valve opening
- Higher discharge temperature
- Greater rod and frame load
- Lower volumetric efficiency
- Higher motor or driver demand
A high receiver pressure set point can increase power even while delivered flow decreases.
23. Effect of suction temperature on power
At constant pressure and mass flow, higher suction temperature generally increases compression work because the gas starts at a higher absolute temperature.
At constant volumetric flow, higher suction temperature reduces mass flow.
Both effects matter:
- Less mass may reduce total power.
- Higher temperature may increase power per unit mass.
- Lower density may change valve flow and capacity.
- Higher discharge temperature reduces thermal margin.
State the flow basis before interpreting power changes.
24. Effect of speed on capacity and power
At moderate conditions:
Capacity tends to increase with speed.
Power also tends to increase because more gas is compressed per unit time.
At high speed, proportionality fails because:
- Valve losses increase
- Volumetric efficiency may fall
- Heating increases
- Piston and ring friction increase
- Pulsation increases
- Lubrication and cooling limits are reached
Never increase speed beyond the manufacturer’s rated range to recover lost capacity before checking the underlying fault.
25. Effect of gas composition
Gas composition changes:
- Molecular weight
- Specific gas constant
- Ratio of specific heats
- Density
- Compressibility factor
- Valve flow velocity
- Compression work
- Discharge temperature
A compressor sized for air cannot automatically be assumed suitable for another gas.
The compressor reference notes that gas composition affects compression efficiency and compressor selection.
26. Effect of compressibility
At higher pressure or for non-air gases, real-gas behaviour may be significant.
Use:
where Z is compressibility factor.
Power calculations may require suction and discharge compressibility factors.
If Z changes substantially through the compressor, the ideal-gas result may be inaccurate.
27. Multistage power
Multistaging with intercooling reduces total work compared with equivalent single-stage compression.
Benefits:
- Lower ratio per stage
- Lower gas temperature
- Lower second-stage inlet volume
- Lower total theoretical work
- Lower final temperature
Actual power includes:
- Intercooler pressure drop
- Valve losses in every stage
- Mechanical losses in every stage
- Cooling-water or fan power
- Condensate-separator losses
The optimum stage count balances theoretical saving against additional losses and cost.
28. Equal work per stage
For a balanced multistage compressor, work should be approximately evenly distributed between stages.
Unequal stage work causes:
- Unequal temperature
- Interstage-pressure deviation
- Excessive rod load
- Capacity loss
- Vibration
- Higher specific power
Stage pressure and stage temperature trends are therefore power diagnostics, not only process readings.
29. Capacity control
Demand may vary from full capacity to nearly zero.
Capacity can be controlled by:
- Start-stop control
- Bypass or blow-off control
- Suction-valve unloading
- Clearance pockets
- Variable speed
- Cylinder unloaders
- Multiple compressors in parallel
A control method must limit both:
- Capacity.
- Power or driver load.
The compressor reference notes that fixed-speed machines require a method other than speed change to alter capacity and that control may be required to prevent excessive horsepower.
30. Start-stop control
The compressor runs until receiver pressure reaches its upper set point, then stops.
Advantages:
- Low unloaded running power
- Simple operation
- Useful for intermittent demand
Limitations:
- Frequent starts
- Motor heating
- Mechanical transients
- Pressure fluctuation
- Reduced suitability for continuous demand
The motor must normally start unloaded to limit starting current and mechanical stress.
31. Bypass control
A bypass returns discharge gas to suction or vents it to a low-pressure point.
Advantages:
- Continuous operation
- Simple capacity adjustment
- Useful where frequent starts are undesirable
Disadvantages:
- Power may remain high while useful delivery falls.
- Gas may be repeatedly recompressed.
- Heat may accumulate.
- Noise and emissions may increase.
Bypass control can be poor for energy efficiency unless the compressor is designed for it.
32. Suction-valve unloading
An unloader holds suction valves open during part of the cycle.
The piston then moves gas without completing normal compression on that end.
Capacity steps may include:
- 0%
- 50%
- 75%
- 100%
Advantages:
- Reduces useful capacity
- Can reduce compression power
- Supports automatic pressure control
The unloader must be correctly timed and lubricated.
33. Clearance-pocket control
Opening a clearance pocket increases cylinder clearance.
The trapped gas re-expands through more volume before suction begins.
Capacity falls while the compressor may continue rotating.
This can be more energy-efficient than bypassing discharge gas, but the actual power reduction depends on compressor design and pressure ratio.
34. Variable-speed control
Variable speed changes piston displacement per unit time.
Advantages:
- Smooth capacity control
- Potentially efficient part-load operation
- Reduced unloaded running
Limitations:
- Driver and control cost
- Minimum speed lubrication limits
- Valve dynamics
- Pulsation changes
- Cooling changes
- Resonance zones
Variable-speed operation must remain within the compressor map.
35. Capacity-control power comparison
The indexed compressor example compares different control steps at changing load conditions and shows that finer control can reduce power consumption in a variable-demand plant.
The practical principle is:
Match delivered capacity to demand with the least unnecessary compression and blow-off.
A compressor that spends long periods unloading or bypassing may have acceptable pressure control but poor specific energy.
36. Capacity-control example
A plant requires 60% of compressor full capacity for most of its operating time.
Poor control
The compressor produces 100% and vents or bypasses 40%.
Better control
The compressor unloads or uses clearance control to produce near 60%.
The second arrangement reduces useful compression of unwanted gas, subject to the control method’s own losses.
The correct choice depends on:
- Compressor type
- Minimum stable load
- Motor behaviour
- Pressure fluctuations
- Start frequency
- Control response
- Safety requirements
37. Specific power consumption
Specific power is the power required for a defined useful output.
Examples:
or:
A rising specific-power trend can indicate:
- Higher discharge pressure
- Lower suction pressure
- Higher intake temperature
- Valve loss
- Ring leakage
- Poor cooling
- Mechanical friction
- Inaccurate flow measurement
- Part-load inefficiency
38. Worked specific-power example
A compressor consumes 110 kW and delivers 20 m³/min on a stated standard basis.
Later it consumes 112 kW but delivers only 18 m³/min:
Power increased only slightly, but specific power increased by approximately 13%.
This is a useful early indication of performance deterioration.
39. Indicated-power example
A compressor cylinder has an average indicated mean effective pressure of 4 bar and piston displacement of 0.50 m³/s.
Idealised indicated power:
This is a simplified demonstration. Actual calculations must account for double-acting geometry, gas units, p-V work, and sign convention.
40. Motor-power example
Suppose:
- Indicated power = 200 kW
- Mechanical efficiency = 95%
- Coupling efficiency = 98%
- Motor efficiency = 94%
Shaft power:
Motor shaft output required through coupling:
Electrical input:
The motor must be selected with suitable margin and starting capability.
41. Power at altitude
At altitude:
- Suction absolute pressure decreases.
- Air mass per actual volume decreases.
- Compression ratio to fixed discharge pressure increases.
- Capacity falls.
- Single-stage temperature may become limiting.
- The machine may require derating.
The power required by a given fixed machine may decrease because less mass enters, but useful delivered mass also decreases. A larger low-pressure cylinder may be required to recover capacity, which changes power and frame loading.
The compressor reference discusses altitude correction for capacity and brake horsepower.
42. Power and cooling
Cooling reduces gas temperature and can reduce compression work.
Poor cooling may cause:
- Higher gas temperature
- Higher specific volume
- Higher stage work
- Lower volumetric capacity
- Poor lubrication
- Valve deposits
- Increased fire risk
Cylinder jackets, intercoolers, aftercoolers, fans, pumps, and cooling-water systems consume auxiliary power that should be included in a complete energy assessment.
43. Power and valve condition
Valve losses affect both capacity and power.
A restricted valve may cause:
- Lower cylinder filling or delivery
- Greater pressure difference across the valve
- Higher indicated work
- Higher cylinder temperature
- Higher motor load per delivered unit
If a valve leaks, gas may be recompressed or returned to the wrong side.
A valve fault can therefore produce low capacity and high specific power simultaneously.
44. Performance-test procedure
A useful compressor performance test records:
Process conditions
- Suction pressure
- Discharge pressure
- Interstage pressures
- Suction temperature
- Stage discharge temperatures
- Cooling-water temperatures
- Cooling-water flow
Machine conditions
- Speed
- Load state
- Unloader position
- Clearance-pocket position
- Valve temperatures
- Vibration
- Lubricating-oil pressure and temperature
Output and input
- Flow on a defined basis
- Motor voltage
- Motor current
- Power factor
- Electrical kW
- Receiver pressure-rise time
- Condensate quantity
Hold conditions steady long enough to obtain representative data.
45. Measurement errors
False performance conclusions may come from:
- Gauge-pressure use in ratio calculations
- Incorrect temperature location
- Flow meter at a different pressure basis
- Uncalibrated pressure gauge
- Wet gas at the flow meter
- Unmeasured condensate
- Unstable receiver pressure
- Motor current used instead of real power
- Ignored auxiliary power
- Incorrect standard-condition conversion
Verify the measurement chain before opening the compressor.
46. Capacity and power trend table
| Trend | Likely interpretation |
|---|---|
| Capacity down, power down | Clearance increase, unloading, low suction density |
| Capacity down, power up | Valve leakage, ring leakage, restriction, high ratio |
| Capacity stable, power up | Mechanical friction, cooling loss, pressure increase |
| Capacity up, power up | Increased speed or demand; verify limits |
| Capacity stable, motor current up | Discharge pressure, voltage, power factor, mechanical loss |
| Interstage pressure low | Preceding-stage capacity loss |
| Interstage pressure high | Succeeding-stage capacity loss or restriction |
| Discharge temperature high | Cooling fault, valve loss, ratio, leakage |
| Specific power rising | Overall efficiency deterioration |
47. Selection from capacity and power data
A compressor selection must satisfy:
- Required mass flow
- Required standard or actual volume flow
- Suction-pressure range
- Discharge-pressure range
- Gas composition
- Temperature limits
- Driver availability
- Part-load range
- Cooling-water availability
- Maintenance capability
- Safety and certification requirements
Do not select solely from the maximum flow number.
The machine must deliver the required flow at the required pressure with acceptable power and temperature.
48. Lifecycle power cost
Power cost is often the largest part of compressed-air cost over the machine’s life.
Lifecycle assessment should include:
- Motor power
- Operating hours
- Electricity or fuel cost
- Cooling auxiliaries
- Maintenance
- Spare parts
- Downtime
- Part-load operation
- Leakage in the distribution system
A more expensive compressor with better specific power may be cheaper over its service life.
The compressor reference stresses that lifetime power cost can greatly exceed initial purchase cost.
49. Distribution-system losses
The compressor may be healthy while useful system delivery is poor because of:
- Receiver leakage
- Open drain valves
- Relief-valve leakage
- Pipe leakage
- Excessive pressure drop
- Unnecessary high set point
- Poorly sized hoses
- Pneumatic equipment leaks
Separate compressor performance from plant demand.
Measure flow near the compressor and at the point of use where possible.
50. Power-limiting control
Power-limiting control prevents:
- Motor overload
- Engine overload
- Excessive rod load
- Frame stress
- High discharge temperature
- Electrical trips
The controller may reduce capacity by:
- Holding suction valves open
- Opening clearance pockets
- Reducing speed
- Stopping a compressor
- Staging multiple compressors
- Limiting discharge pressure
A power limit is not the same as a capacity target. The controller must manage both.
51. Capacity staging in multiple compressors
When several compressors operate in parallel:
- Lead unit may run near efficient load.
- Additional units start as demand rises.
- Units stop as demand falls.
- Pressure band determines sequencing.
Poor sequencing can cause:
- Several units lightly loaded
- Repeated start-stop cycles
- Unnecessary blow-off
- High specific power
- Unequal running hours
A good sequence maintains required pressure with the fewest efficient units online.
52. Compressor power and receiver pressure
Receiver pressure control changes the compressor operating point.
Higher receiver pressure:
- Increases compression ratio.
- Increases power per unit mass.
- Reduces volumetric efficiency.
- Raises discharge temperature.
- May reduce capacity.
Use the lowest receiver pressure compatible with the equipment and process.
Do not compensate for distribution leakage by raising pressure without checking the leak source.
53. Revision questions with answers
Question 1
What is piston displacement?
Answer: Geometric swept volume per unit time.
Question 2
What is actual capacity?
Answer: The gas volume or mass delivered at a defined pressure, temperature, and reference basis.
Question 3
What does ACFM mean?
Answer: Actual cubic feet per minute at stated actual conditions.
Question 4
What is free-air delivery?
Answer: Delivered gas referred to an agreed reference condition.
Question 5
What is indicated power?
Answer: Power calculated from work performed in the compressor cylinders.
Question 6
What is shaft or brake power?
Answer: Mechanical power supplied to the compressor shaft.
Question 7
What is compression efficiency?
Answer: Theoretical compression work divided by actual indicated work.
Question 8
What is mechanical efficiency?
Answer: Indicated power divided by shaft power.
Question 9
What is specific power?
Answer: Input power divided by useful delivered flow or mass flow.
Question 10
Why does discharge pressure increase power?
Answer: It increases compression ratio and required compression work.
Question 11
Why does suction temperature affect capacity?
Answer: It changes inlet density and therefore mass entering per unit volume.
Question 12
Why can motor current alone be misleading?
Answer: Current does not directly provide real power or account for power factor and motor efficiency.
Question 13
Name four capacity-control methods.
Answer: Start-stop, bypass, suction-valve unloading, clearance pockets, variable speed, or multiple-unit sequencing.
Question 14
Why is multistaging power-efficient?
Answer: Intercooling lowers gas temperature and divides the pressure ratio.
Question 15
What is the best general performance indicator?
Answer: Specific power at a defined flow and pressure basis, trended against a known baseline.
54. Self-test scenarios
Scenario A — capacity falls and specific power rises
Check:
- Discharge pressure
- Suction pressure
- Valve leakage
- Ring leakage
- Cooling
- Flow-meter basis
- Unloader position
Scenario B — motor overload at high receiver pressure
Check:
- Pressure set point
- Discharge restriction
- Stage pressure balance
- Cooling
- Valve condition
- Power-limiting control
Scenario C — flow appears low at high temperature
Convert the measured flow to a common reference condition before concluding that the compressor has lost capacity.
Scenario D — all parallel compressors run lightly loaded
Check:
- Sequencing logic
- Pressure band
- Unloaders
- Receiver size
- Plant leakage
- Minimum-load operation
Scenario E — compressor is healthy but plant pressure is low
Check:
- Distribution leakage
- Open drains
- Hose restrictions
- Point-of-use demand
- Pressure drop
- Inadequate receiver volume
55. Performance-test checklist
- ☐ Define the capacity basis.
- ☐ Measure suction absolute pressure.
- ☐ Measure discharge absolute pressure.
- ☐ Measure suction temperature.
- ☐ Measure discharge temperature.
- ☐ Record speed.
- ☐ Record load and unloader condition.
- ☐ Measure actual electrical kW.
- ☐ Record power factor.
- ☐ Record cooling conditions.
- ☐ Record condensate condition.
- ☐ Convert flow to a common basis.
- ☐ Calculate compression ratio.
- ☐ Calculate volumetric efficiency where possible.
- ☐ Calculate specific power.
- ☐ Compare against baseline.
- ☐ Check distribution-system losses.
56. Chapter-seven study checklist
- ☐ Define capacity.
- ☐ Define piston displacement.
- ☐ Distinguish ACFM, ICFM, FAD, SCFM, and mass flow.
- ☐ Explain the need for reference conditions.
- ☐ Convert volume between pressure and temperature bases.
- ☐ Define theoretical compression power.
- ☐ Define indicated power.
- ☐ Define shaft or brake power.
- ☐ Define motor input power.
- ☐ Explain compression efficiency.
- ☐ Explain mechanical efficiency.
- ☐ Explain overall efficiency.
- ☐ Define specific power.
- ☐ Explain suction-pressure effect.
- ☐ Explain discharge-pressure effect.
- ☐ Explain temperature effect.
- ☐ Explain speed effect.
- ☐ Explain gas-composition effect.
- ☐ Explain multistage power saving.
- ☐ Explain capacity control.
- ☐ Explain power-limiting control.
- ☐ Interpret capacity and power trends.
- ☐ Complete a performance test.