
Indicator Diagrams & Engine Performance
How a pencil, a drum and a spring turn cylinder pressure into power, balance and fault-finding.
Key Principles at a Glance 5 points
- Ten parameters move together with load — MIP, compression, max pressure, pump index, exhaust and scavenge readings plus turbo speed tell one story.
- Indicated power is diagram area turned to pressure (Pm = a/l × k) times swept volume times firing rate — PmLAN with the right n.
- Cards are taken by ritual: soot blown, paper stretched, atmospheric line first, short hot exposure, fuel-cut compression line, clean-and-oil after.
- Four cards, four lenses: power for work and MIP, compression for sealing health, draw for combustion timing, light-spring for gas exchange.
- Balance by pump index and cams, spares ready for instant valve swaps — but main-engine timing stays untouched at sea.
1. The Load Picture & Power Definitions
Engine load is read against a fixed baseline — clean hull, normal trim, matched propeller. Hold those three steady and ten parameters move together with load.
Draught, trim and hull condition sit outside the engine but decide what "normal" looks like. Power pushed to the propeller becomes thrust against hull resistance — so compare readings only at like-for-like hull and propeller conditions.
| Group | Parameters that track load |
|---|---|
| Cylinder | Mean indicated pressure · Compression pressure · Maximum combustion pressure |
| Fuel setting | Fuel-pump index (load-indicator position) |
| Gas path | Exhaust gas pressure · Exhaust gas temperature · Scavenge air pressure · Scavenge air temperature |
| Turbocharger | Turbocharger speed · Uptake pressure after the turbocharger |
Logged every voyage in both conditions, plus a fresh set after each major overhaul, this record tracks completeness of combustion and cylinder health over time.
Indicated power (IP)
Power born inside the cylinder, read off the indicator diagram. Fuel burns, gas pushes the piston — this is the gross work before any losses.
Brake power (BP)
Power available at the flywheel for real work. Friction and attached losses take their cut, so BP is always below IP. Measured on a hydraulic dynamometer or torsionmeter.
Mechanical efficiency
How much cylinder power survives friction. BP / IP × 100% — the tighter the engine, the closer to 100.
Thermal efficiency
How much fuel heat becomes work. Output (IP or BP basis) over fuel mass flow × calorific value — quoted as indicated or brake thermal efficiency.
SFOC
Specific fuel oil consumption — fuel burned per unit power. The price tag that links every parameter above to the bunker bill.
2. PmLAN — Area Into Power
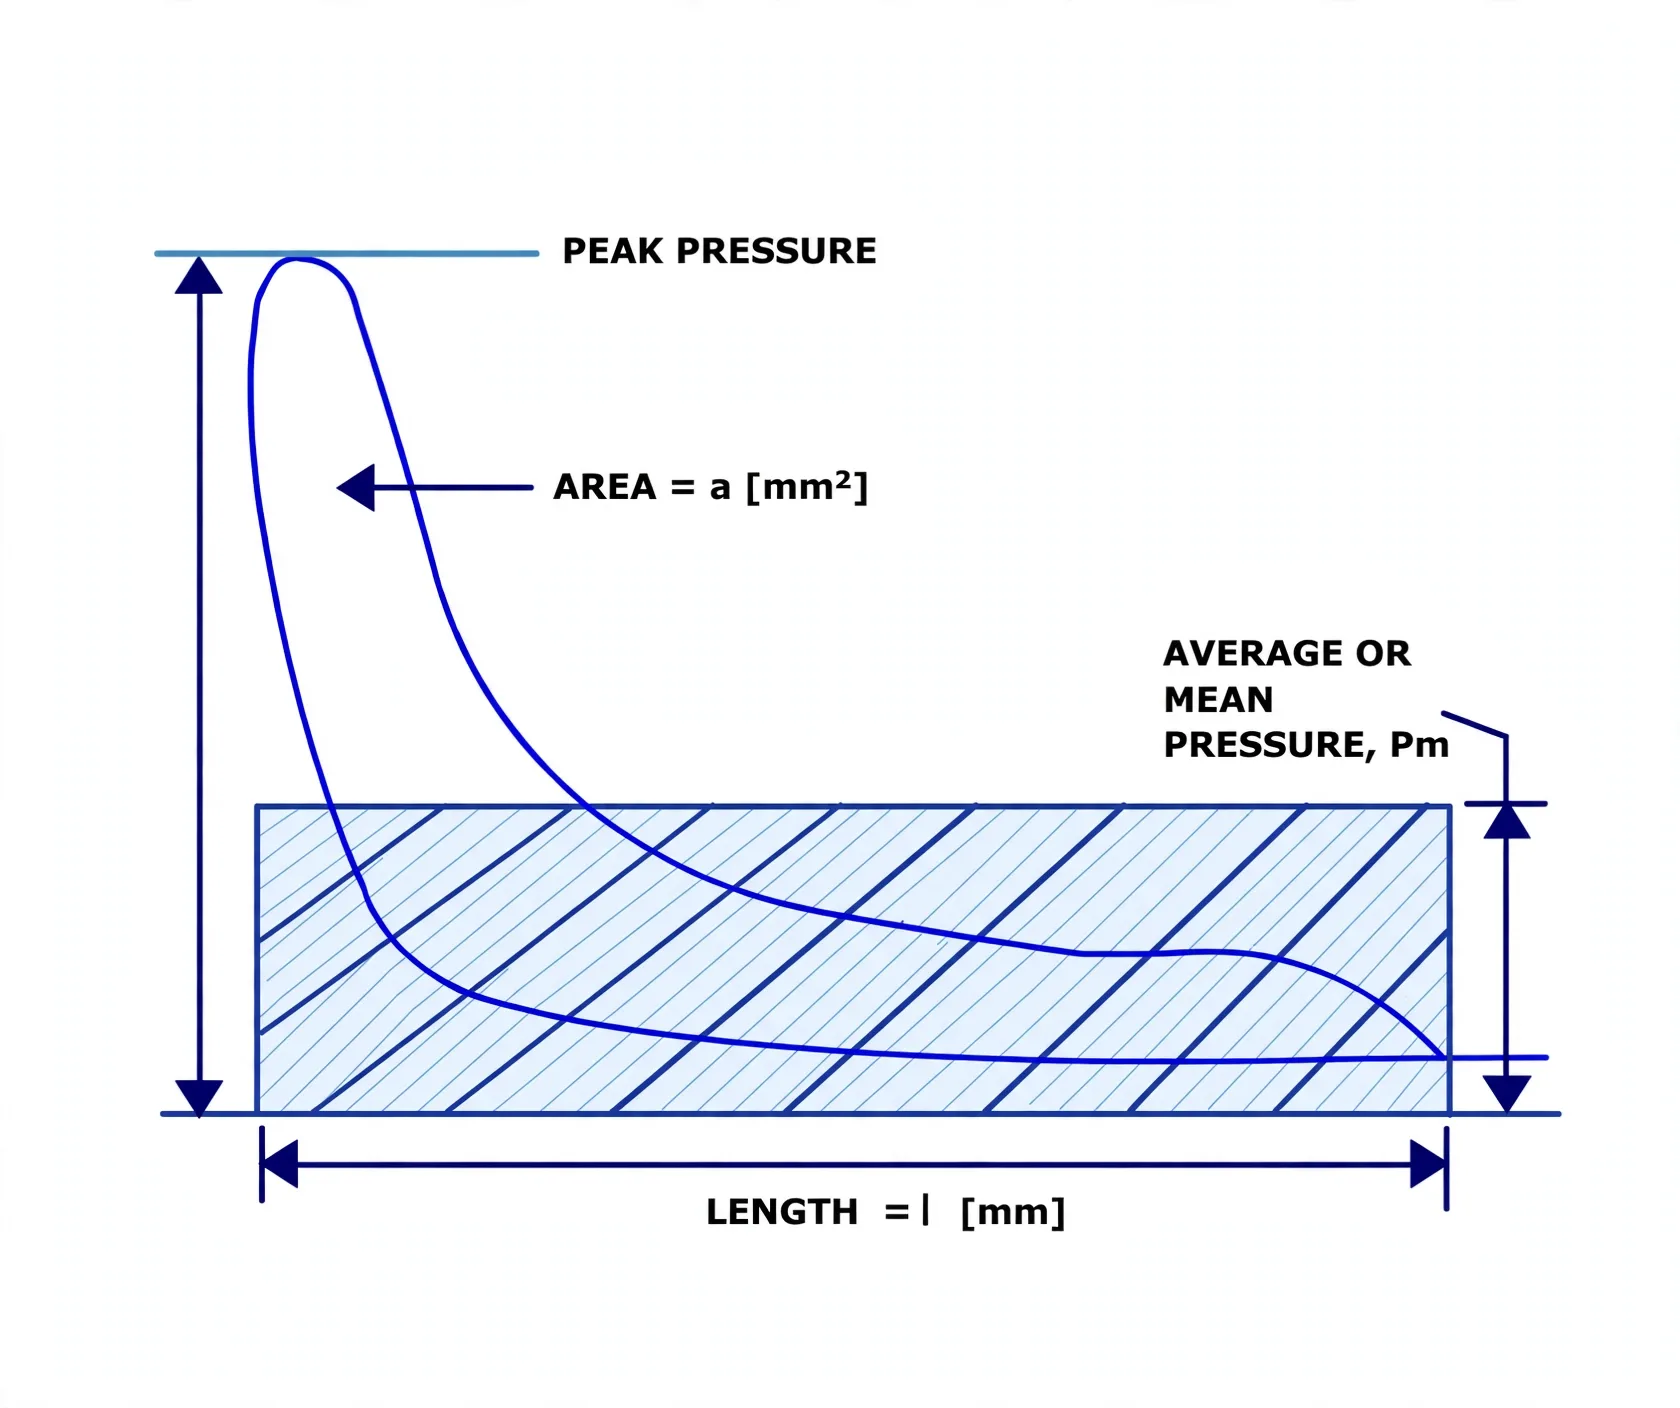
Planimeter (or mid-ordinate) the card area a, divide by length l, multiply by spring scale k — that mean height is Pm in bar. Power per unit is Pm × piston area × stroke × firing rate, with n = rev/s on two-strokes and rev/s ÷ 2 on four-strokes (single-acting). Bar·m·m²/s resolves through 10⁵ N/m² into watts; kN/m² lands directly in kilowatts.
3. Taking Cards Without Lying to Yourself
Spring matched to expected peak.
Paper drum-tight.
Cocks blown through firing strokes to clear soot.
Atmospheric line first, drive hooked, cock open — power card drawn, cock shut, instrument spared prolonged heat.
Drum hand-turned clear, fuel cut, compression line drawn for sealing truth.
Every unit in turn, then strip, clean, oil and stow the instrument — the engine's stethoscope deserves clinical care.
Lubricate against seizure, prove free piston sliding, keep cocks carbon-clear, touch the stylus lightly, cool between units — each precaution guards one error source.
4. Four Cards, Four Lenses
| Card | Taken how | Reveals |
|---|---|---|
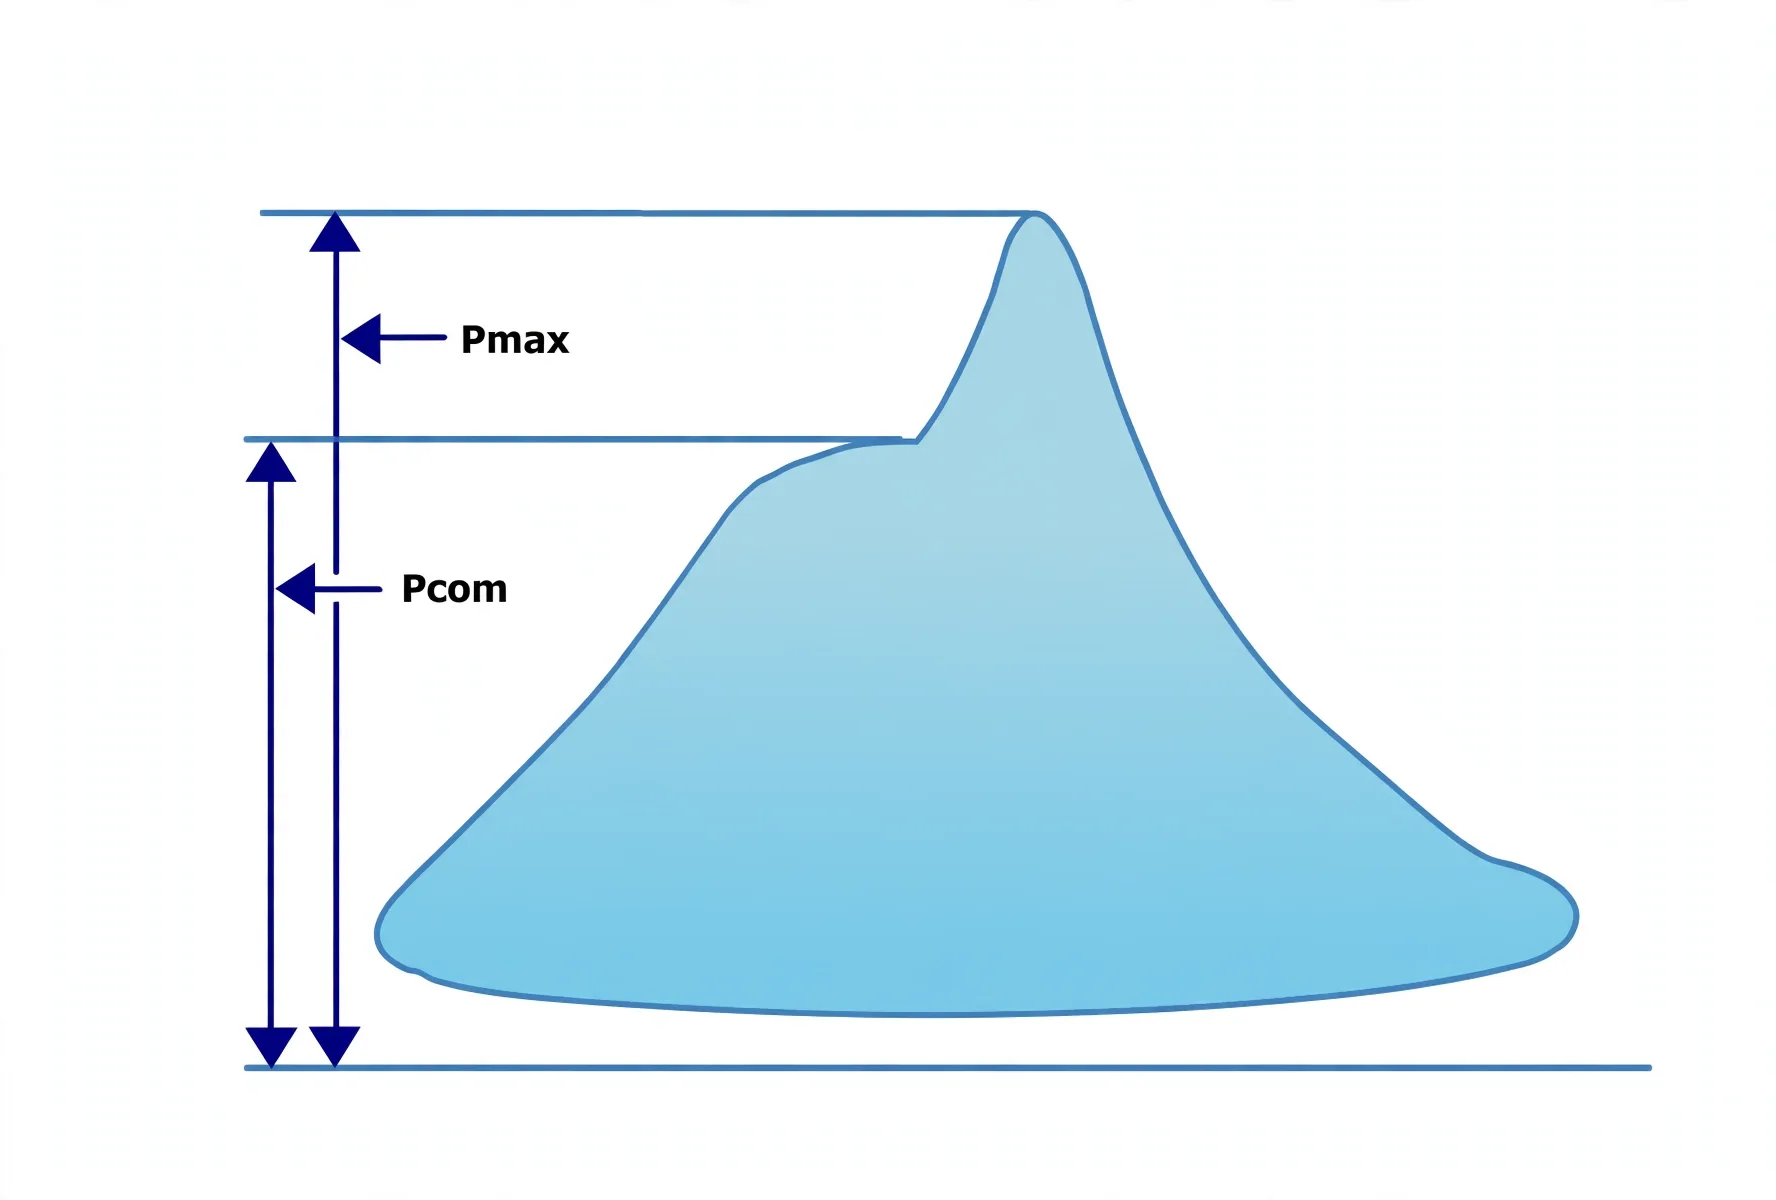
| Power | Drum in phase, normal firing | Work area, MIP, Pmax, Pcom — the master card |
| Compression | Fuel cut, same phasing | Sealing health — coincident lines prove sync; sagging height blames liner, rings, air or exhaust valve |
| Draw (90° out) | Fuel on, drum quarter-turn displaced | Combustion timing and injector faults in stretched detail |
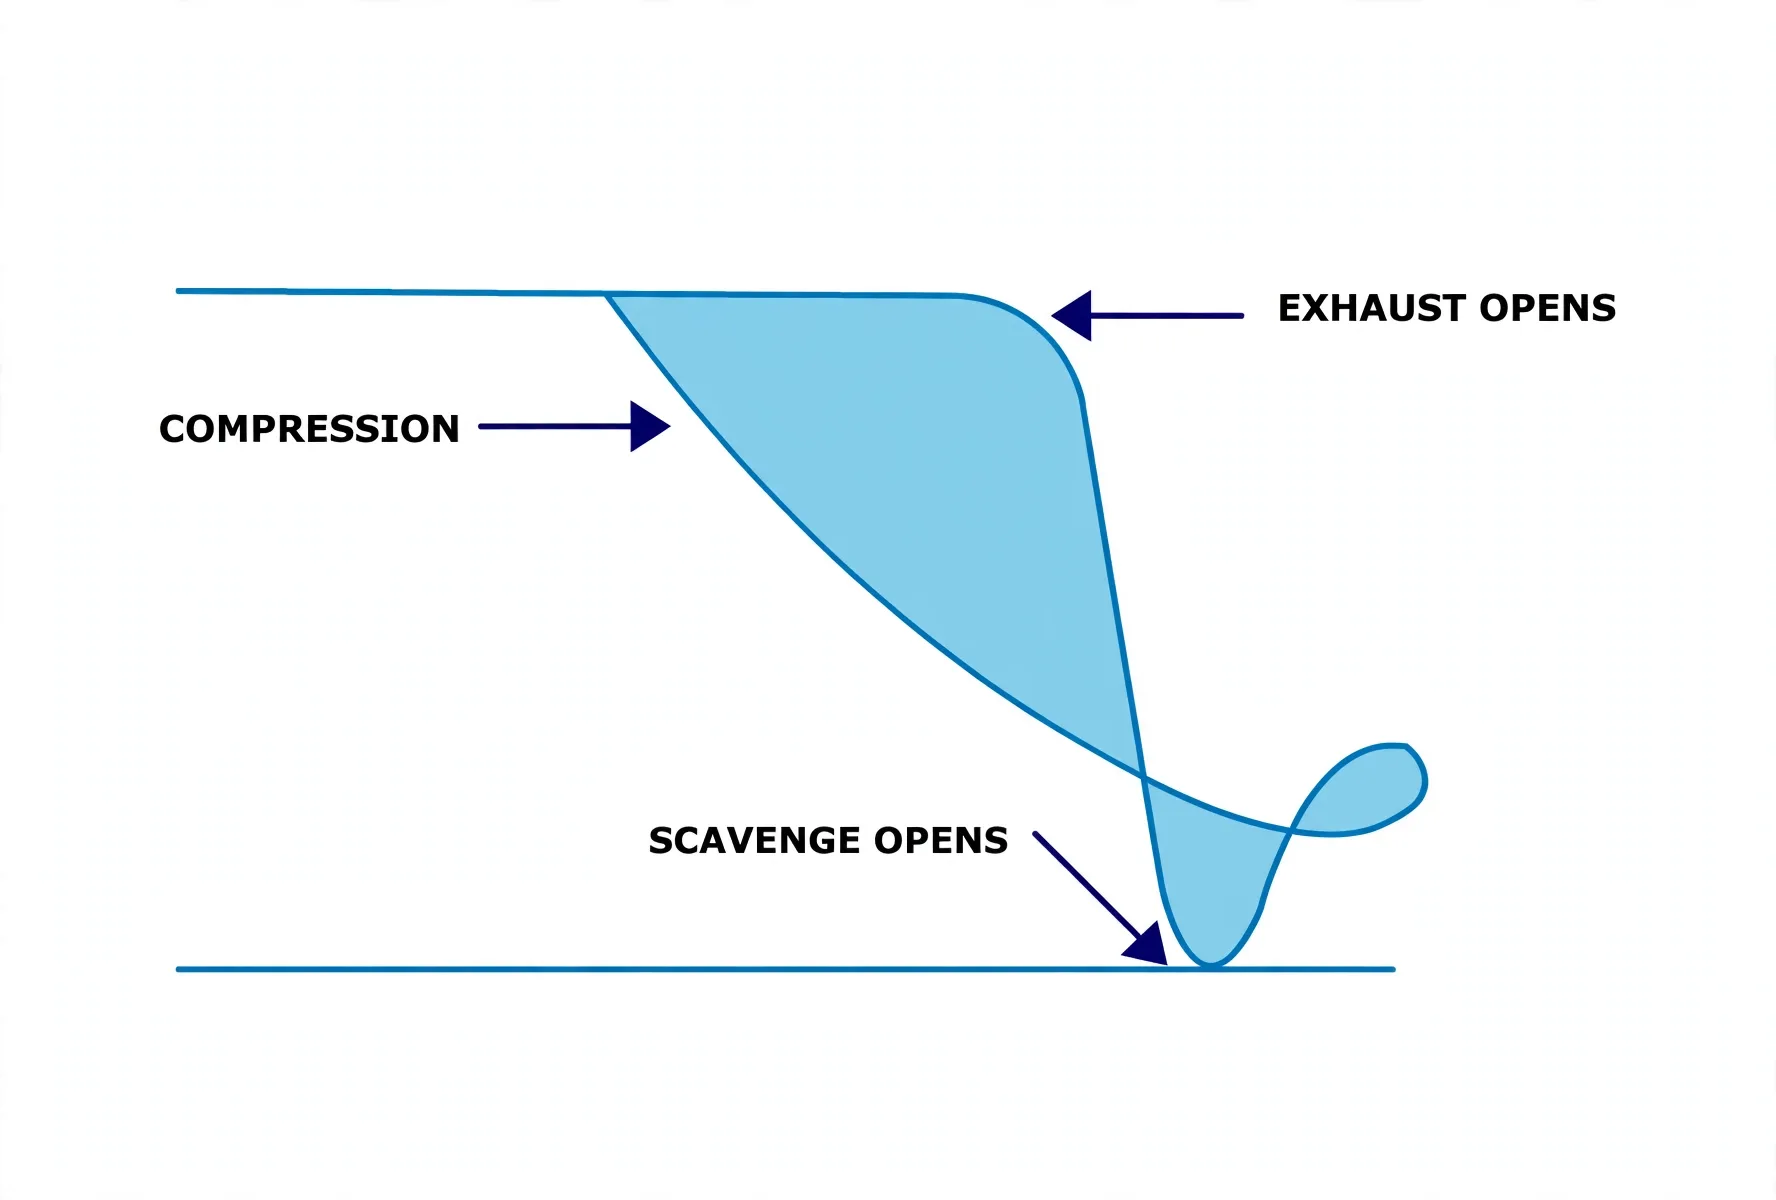
| Light spring | Soft spring, in phase | Exhaust/scavenge pressures magnified — gas-exchange faults exposed |
At-sea discipline: exhaust temperature per unit flags imbalance daily.
- Leaky fuel valves, wrong valve events and choked exhaust passages read straight off the cards.
- Bench-tested spare injectors and exhaust valves stand ready for momentary-stop swaps — defective valves never keep running.
- Main-engine cams and timing wait for port.